Unveiling the Beauty of Statistics
At Brandt Ronat and Company we are often tasked with presenting data in a compelling manner, so we’re always on the lookout for new programs, methods and designs to inspire these visualizations.
One such thing is Gapminder’s Trendalyzer. The Trendalyzer is an extremely powerful tool for understanding the world through a variety of indicators over a long period of time. Its ease of use belies its depth, which is why I’m writing this article now and not in 2008…
I first saw the Trendalyzer in action in late 2008 when I watched Hans Rosling’s TED presentation Debunking Myths about the “Third World”. I was captivated by his moving circles, so when I found out I could play with that very tool I rushed over to the website to give it a try.
I looked at a few different indicators for several minutes then went back to work and forgot about it until the other day. I received a tweet with a link and the words “Perhaps best graphical use of data on the Web”. So in hope of discovering something astounding I could share with co-workers and clients, I clicked and found my self back at Gapminder.
Since 2008, I’ve had a greater need for having a variety of visualization solutions in my bag of tricks, so I decided to take another look. It turns out they were wrong.
It’s not just the best graphical use of data on the Web, it is the most intuitive way to visualize multiple data sets over time.
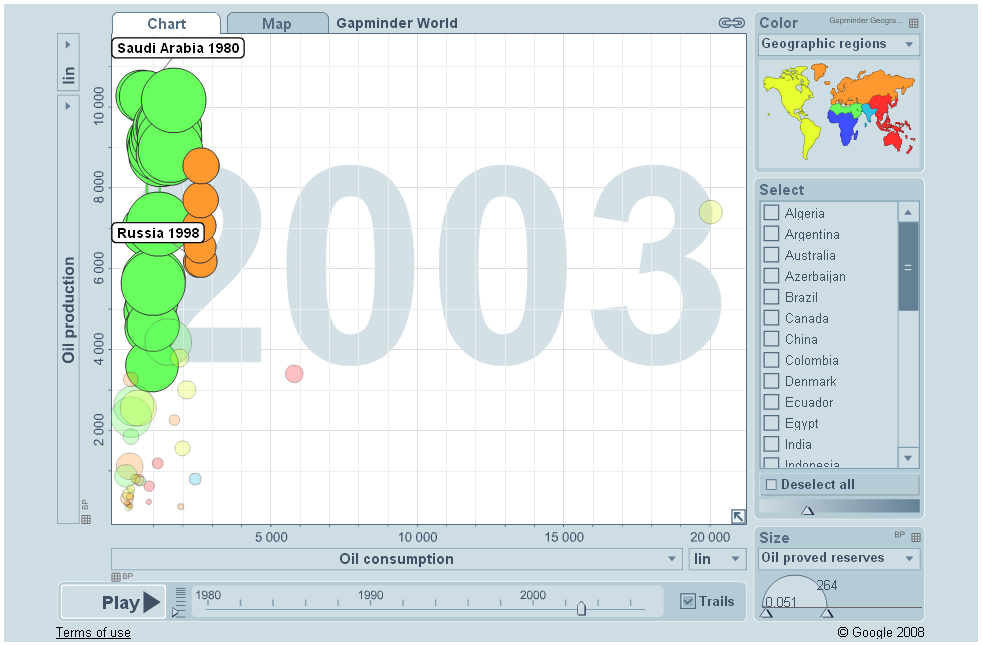
To do this, Trendalyzer charts each “entity” (often a country) using color, size and movement.
One great thing is that all the parameters for the graph are pulled from the URL, so it’s easy to share the same setup with others.
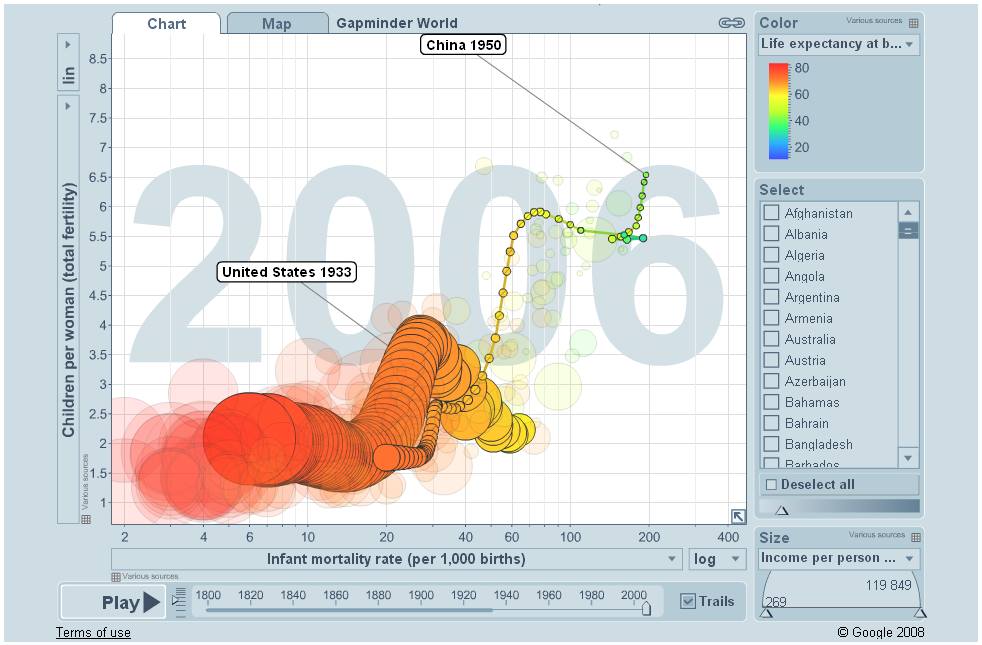
For instance, I made a chart that explores the relationship between a country’s infant mortality rate, its life expectancy, its income per person and its total fertility.
I have tracked USA and China, so their paths will be displayed as trails of points, while the other countries are transparent. Infant mortality is measured on the x-axis, total fertility on the y-axis, life expectancy by color of the point, and total income by the size of the point. If you press play (at the bottom) the time line will begin and the points will move and grow as time moves along.
They have many different indicators that you can have displayed by one of the 4 dimensions (axes, size, color), making this a very powerful, but very intuitive way to present a lot of time-based data.
Another cool thing they have is Map view:
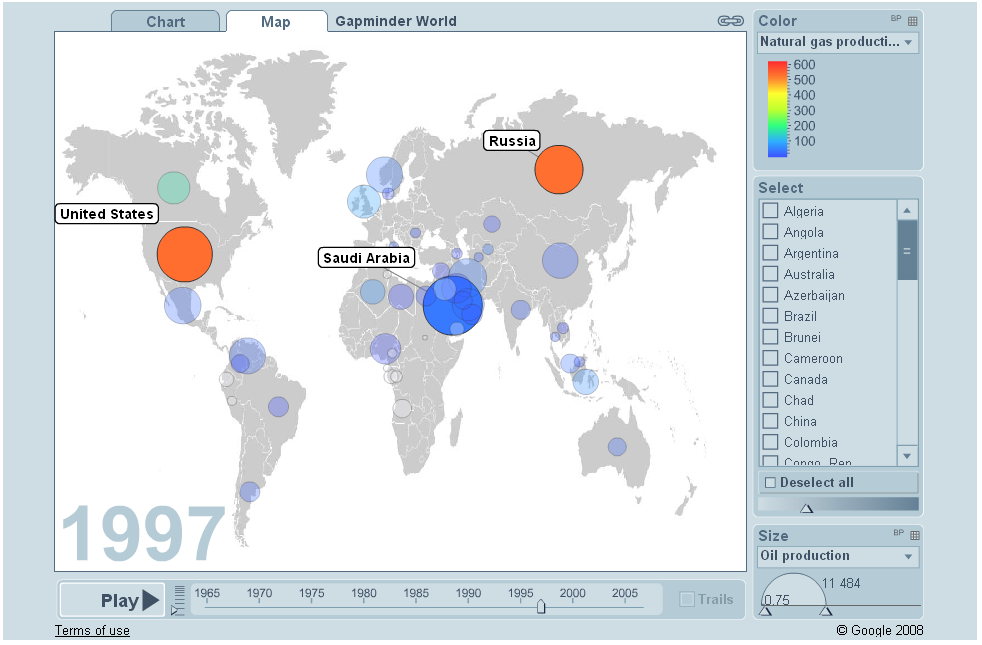
Map view puts the points on a map of the world and allows 2 indicators to be measured by size and color.
Their main goal in making this data and software available is to fill a data gap between people who want to explore this world data, but don’t have access to it, or can’t interpret it in its raw forms. They’re also hoping that access to this data will make falling back on assumptions, stereotypes and common sense unnecessary.
Google purchased the software behind this and they offer it free of charge.
http://www.google.com/ig/directory?url=www.google.com/ig/modules/motionchart.xml
http://code.google.com/apis/visualization/documentation/gallery/motionchart.html
I haven’t tried using the Google version and uploading my own data yet, but I’m looking forward to getting a chance to try it out.
The main thing to remember is that it’s hard for raw figures to inspire someone. When you allow a user to explore your data in a way that’s relevant to them, you can easily get them energized about your cause. Would you rather look at this and this or have those numbers come alive like this?
brandt ronat + company is a marketing solutions firm known for creating brand strategies and high-value message development, sustainable communications and advertising systems for clients in space and technology, health and wellness, the financial services industry, community infrastructure, real estate development and retail. Clients include Brevard Workforce, the Economic Development Commission of Florida's Space Coast, Community Credit Union of Florida, Growth Innovators, Space Coast Health Foundation, Federated Precision, Gatto's Tires & Auto Service, Florida Space Day Committee, Lawler Centre for Cosmetic Surgery, University of Central Florida, Brevard Schools Foundation, Essentials Spa, Space Coast Office of Tourism and Space Foundation (located in Colorado, Florida and Washington, D.C.).